In mathematics, graphs are used to visually represent the relationship between two sets of data. A graph is made up of two main components: the axes, which represent the two sets of data being compared, and the data points, which are plotted on the graph to show how the two sets of data are related. There are several different shapes that graphs can take, each with its own name and meaning.
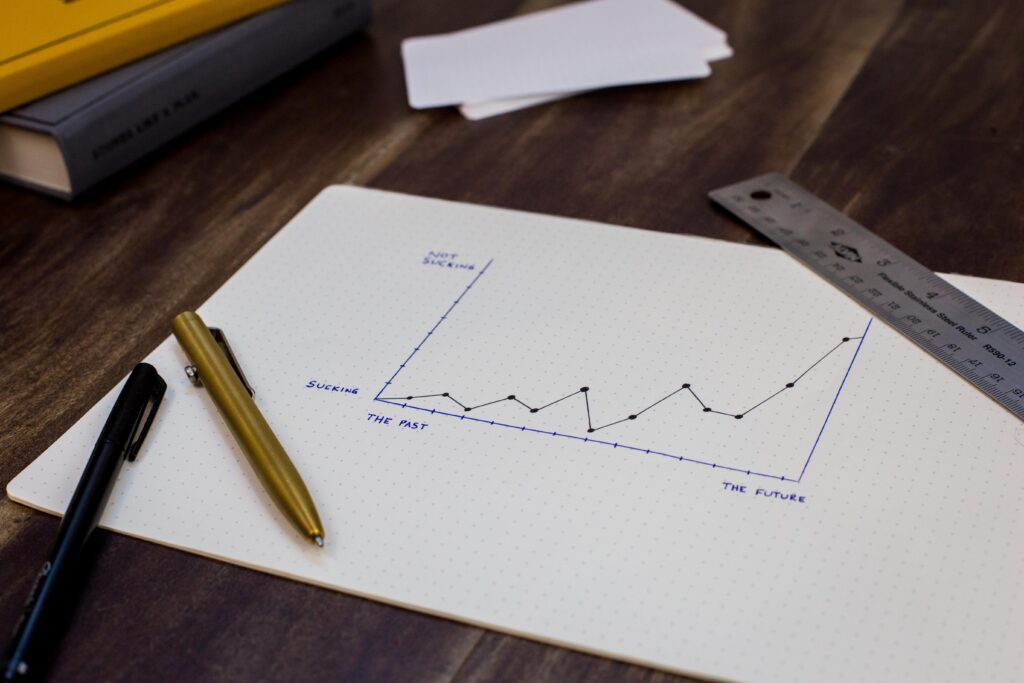
- Line Graph: A line graph is a graph that displays data points connected by straight lines. It is often used to show trends over time or to compare two sets of data. In a line graph, the x-axis represents time or some other variable, while the y-axis represents the quantity being measured.
- Bar Graph: A bar graph is a graph that uses rectangular bars to represent data. The height of each bar represents the value of the data being measured. Bar graphs are often used to compare data between different groups or categories.
- Scatter Plot: A scatter plot is a graph that uses dots to represent data points. It is used to show the relationship between two sets of data. The x-axis represents one set of data, while the y-axis represents the other set of data. The position of each dot on the graph represents the value of both sets of data for that particular point.
- Pie Chart: A pie chart is a circular graph that is divided into sections. Each section represents a portion of the whole. The size of each section is proportional to the value of the data being measured. Pie charts are often used to show percentages or fractions.
- Area Graph: An area graph is a graph that uses colored areas to represent data points. It is similar to a line graph, but the area under the line is filled in with color. Area graphs are often used to show the cumulative effect of multiple data sets over time.
- Histogram: A histogram is a graph that displays the distribution of a set of data. It uses rectangular bars to represent the frequency of data within specific intervals. Histograms are often used in statistics to show the frequency of data within certain ranges.
- Box and Whisker Plot: A box and whisker plot is a graph that shows the distribution of a set of data. It uses a box to represent the middle 50% of the data, with a line in the box representing the median. Whiskers extend from the box to represent the minimum and maximum values of the data set.
These are just a few of the most common shapes that graphs can take. There are many other types of graphs, each with its own specific purpose and characteristics. By using the right type of graph for the data being presented, one can create a clear and effective visual representation of complex information.
What are the Different shapes of a graph called?